So today I stopped for awhile. And before I continue reading, I want to try out and iron out some of the important and basic things I learnt.
In the technical strategies chapter, on the very first topic, it taught something like a multi-period analyzing. It basically means that before you analyze the hourly chart, you take a look at the daily chart to gain an idea of the big picture. And from the big picture, you determine if it is good to go long or short.
After that, you move on to the hourly chart and look for entrancement to get in. It is pretty similar to what I did last time, but this time, I will be using resistant lines.
Currently, to keep things simple, I only have the daily and hourly chart. If I have even more time for day trading, I can even open a 15 min chart. But for now, I will just use the former 2.
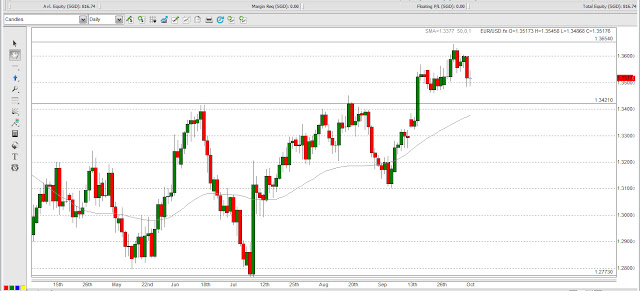
The first thing I do for both charts is to draw out major resistant lines. After that, I look at the daily chart first to determine to go long or short. This can be determined when you see the trend being rejected by a resistant zone repeatedly.
After determining to go long or short, I use the hourly chart to help me choose a time to enter. This time, if I want to go short, I will look for the trend to retrace upwards to a resistant zone before I enter the trade. I will be hoping that the resistant zone rejects the trend and continues downward, contrary to a breakout.
So below are the steps
- Draw major resistant lines on both Daily and Hourly chart
- Look at the Daily chart to know to go long or short
- Look at the Hourly chart to find a right time to get in
Below is the Daily chart, followed by the Hourly chart of EUR/USD


No comments:
Post a Comment