Success
Failure

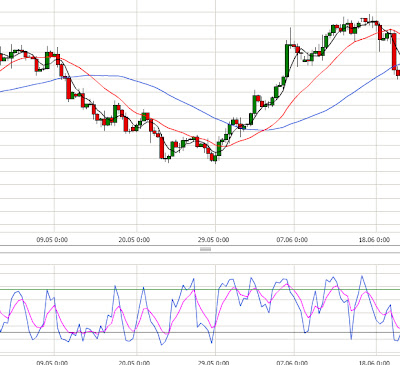
Notice the difference. A successful chart looks like a pattern that keeps jumping up and down, even though it is heading in 1 direction. Whereas the unsuccessful chart have little jumps over some time, and suddenly spikes occasionally.
And I realized that for Forex, if I drag the time line longer to 8 hour candlesticks, it will start to form charts that are suitable for trading the Bread N Butter technique. The above 'Success' chart is using 8 hour candlesticks, and the below chart is plotted with 1 hour candlesticks.
I will start using 8 hour candles now on, and hope it produce desirable results.
'8' is also the Chinese favorite number, which is pronounced as 'Prosperity' in one of the dialects.
Huat ar!


No comments:
Post a Comment